


This marks the third time in two weeks that MAIA has been included in an article by Citywire.
The full article is below.

Revealed: Nine in 10 passive MPS portfolios beat active stablemates
Exclusive Citywire analysis reveals the scale of passive MPS portfolios’ outperformance versus active counterparts for the first time.
Nine out of 10 passive managed portfolio services (MPSs) have beaten the returns of their active counterparts over the past three years, as the relentless rise of the US market has fuelled the unprecedented dominance of index approaches.
Exclusive Citywire research has revealed for the first time the scale of passive MPSs’ outperformance of their active stablemates. Analysis of more than 350 portfolios, matching passive MPSs against active counterparts run by the same provider and targeted at the same risk level, found passive portfolios delivered higher returns in 88% of cases over three years.
Over the 12 months to the end of June, passive MPSs were similarly dominant, outperforming active counterparts in 82% of cases. Only over five years did active MPSs narrow the performance gap significantly – over that timeframe, passive outperformance fell to 61% of cases.
Passive vs active: How MAIA have fared
Three-year net returns to 30 June 2024
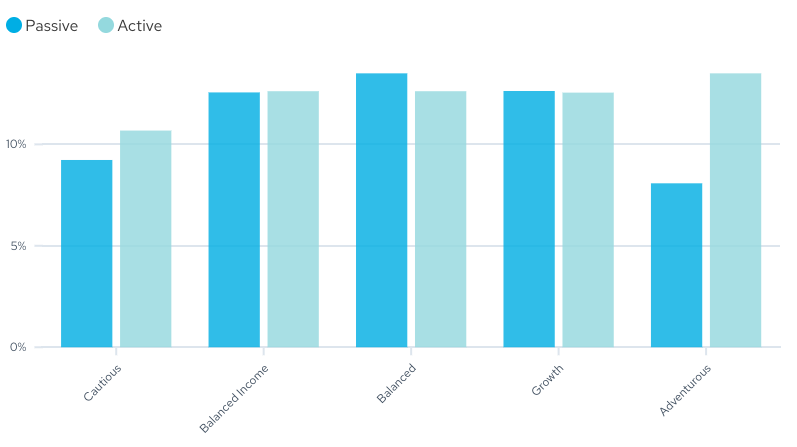
Sources: Morningstar, Mabel Insights, MPS providers
The dominance of passive MPS approaches eclipses even trends in the funds sector, where a just over a third of active funds have outperformed passive alternatives this year, according to a study last month by investment platform AJ Bell.
It’s reflected in a rising proportion of passive investment among MPS providers, with index approaches now accounting for 43% of MPS assets, according to consultancy NextWealth, up from 29% two years ago.
Citywire’s analysis found that over the three years to the end of June, passive MPSs had outstripped the returns of their active counterparts by an average of 4.3 percentage points. Over one and five years, their returns were respectively 1.6 and 1.8 percentage points higher.
Passive outperformance is even more pronounced for certain providers. For example, Binary Capital’s Passive Adventurous MPS has returned 13% over three years versus a 6.8% loss for its Active Adventurous counterpart – a 19.8 percentage point difference.
Similarly, 7IM’s Passive Adventurous Plus MPS has delivered a 21.3% return over three years, ahead of just 5% for its Active Adventurous Plus strategy.
Rallying US market boosts passives
Ben Kumar, 7IM head of equity strategy, said the rise of the US market over the past five years had been responsible for the major disparity in performance.
‘It’s been the best five-year period for the US market, which dominates passive indices,’ he said, pointing to the country’s 72% weighting in the MSCI World index.
Over the past five years, the US S&P 500 index has returned 96% in sterling terms, nearly double the 49% return from the MSCI Europe index.
‘It’s become bigger and bigger and bigger as part of passives, and there hasn’t been anything doing better than it,’ Kumar added. ‘In a world where the biggest companies or the biggest markets do the best, passive will always outperform.
‘The way I think about active management – whether it’s asset allocation or stock selection – you’re very rarely going to add more to the big companies. In general, active managers or active allocators are looking for reasons or areas where the passive might be wrong or might be too risky, or there might be opportunities elsewhere. In general, active managers are going to go away from whatever the biggest force is in the index.’
That’s reflected in the differing allocations to the US market in 7IM’s active and passive MPS ranges. Both adopt the same strategic asset allocation – in the case of the Adventurous Plus portfolios, this allocates 34% to North American equity. But unlike their passive counterparts, the Active Adventurous Plus managers also adopt a tactical allocation, which last month reduced this allocation to North American shares by seven percentage points.
Nine in 10 passive MPSs beat active peers over three years
Net returns to 30 June 2024
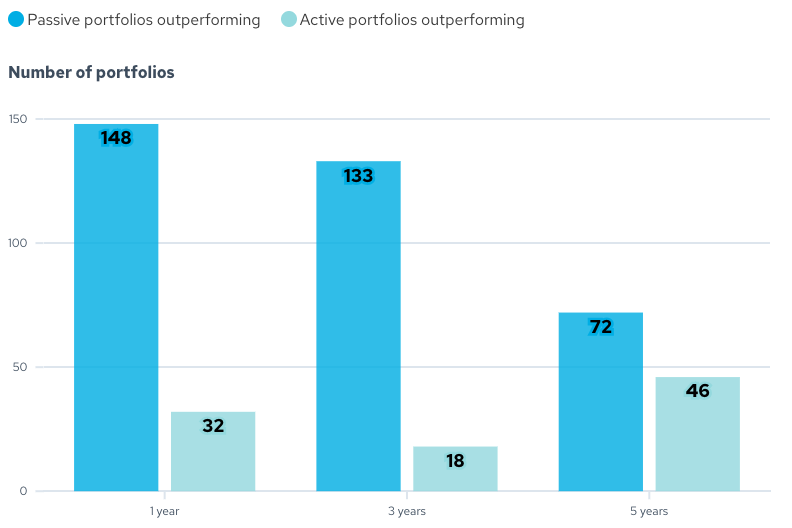
Sources: Morningstar, Mabel Insights, MPS providers • Net returns from passive MPSs compared against active equivalents from same provider
The lagging performance of active MPSs versus passive counterparts has meanwhile been exacerbated by the narrowness of the US bull market, said Saftar Sarwar, chief investment officer at Binary Capital.
‘Clearly, active portfolio management over the last five years hasn’t done as well, and one of the key reasons has been the fact the market has been very, very narrow in terms of the best equities that have done well,’ he said. ‘If active managers didn’t hold those positions in significant weightings, they didn’t perform well – they underperformed the market.’
The Magnificent Seven technology stocks – Apple, Microsoft, Google parent Alphabet, Amazon, Nvidia, Facebook owner Meta, each rated AAA by Citywire Elite Companies, and A-rated Tesla – have been responsible for an outsized proportion of the US market’s returns. According to Morgan Stanley, they accounted for more than half the S&P 500 index’s gain last year.
Will Dickson, chief investment officer at P1 Investment Management, said a skew towards smaller companies, resulting in smaller weightings to the Magnificent Seven, had contributed to P1’s active Wealth Accumulator MPS range lagging the performance of its passive Asset Tracker portfolios.
‘When you are using active funds to populate MPSs rather than passive, naturally you are going to have a small-cap skew as a result of how active managers are populating their own funds,’ Dickson said. ‘On top of that, within our Wealth Accumulator MPSs, we tend to have a more structural bias towards smaller companies.
‘Naturally, you are going to have less of those Magnificent Seven stocks and, given how well those have done, that’s obviously been a headwind for any kind of strategy that isn’t market cap-weighted.’
Each of P1’s five Asset Tracker portfolios has outperformed its Wealth Accumulator equivalent over one, three and five years to the end of June. The biggest gap in performance is between its Adventurous portfolios: the Asset Tracker MPS has returned 49.7% over five years, ahead of 35.5% from the Wealth Accumulator version.
Where has the data come from?
Citywire has sourced data for this series on MPS performance from investment data group Morningstar, MPS ratings provider Mabel Insights and MPS managers.
That has enabled us to build an extensive picture of performance across Morningstar’s six biggest MPS sectors: EEA Model GBP Allocation 0-20%, 20-40%, 40-60%, 60-80% and 80%+ Equity, and EEA Model Global Large Cap Blend Equity.
Our analysis has encompassed 1,108 MPS portfolios, with all returns quoted net of MPS provider fees and the costs of their underlying funds.
How those return figures have been calculated differs slightly depending on how they were sourced.
Morningstar’s data is based on the group’s own calculations of MPS performance using portfolio holdings data provided by MPS managers. MPS providers who sign up to its database are required to submit updated portfolios within five days of any rebalance or trade.
Mabel Insights’ performance data is sourced either directly from partner MPS providers or from providers’ factsheets. In cases where data was available from both sources, differences were largely marginal.
Where data has been sourced other than from Morningstar, Citywire has mapped portfolios to the data provider’s sectors based on asset allocation.
Citywire has used data from Morningstar, Mabel Insights and MPS providers in a bid to capture the return from as many portfolios as possible.
Diversification weighs on active portfolios
The differing performance between active and passive MPSs isn’t just down to the Magnificent Seven. Other factors have had an impact too, some of which are rooted in fundamental differences between the two approaches, such as the breadth of investments available to each. Broadly, not all of the strategies or investments available to managers of active MPSs can be replicated in passive form.
Jasper Thornton-Boelman, investment director at Parmenion, pointed to its Tactical Active and Strategic Active MPS ranges’ exposure to the China A-Shares market. Both ranges hold the Allianz China A-Shares Equity fund, with exposures peaking at 6.1% in the Tactical Active Risk Grade 10 MPS and 3.6% in Strategic Multi-Option Active Risk Grade 10 in May, according to Morningstar data.
There is no equivalent holding in their Tactical Passive and Strategic Passive equivalents. ‘We couldn’t find a passive vehicle to replicate that in the passive MPSs,’ said Thornton-Boelman.
‘That’s a slight asset allocation difference that has contributed quite a lot to the [active] underperformance at the higher end [of risk levels], as you may expect given the extent that China, and particularly the A-Share market, has been out of favour.’
Allianz China A-Shares Equity lost 47.1% over the three years to the end of June.
Nearly all of Parmenion’s Tactical Passive and Strategic Passive MPS ranges, which feature 10 portfolios each, have outperformed their Tactical Active and Strategic Active equivalents over one, three and five years.
Only the most conservative Risk Grade 1 active portfolios have consistently outperformed their passive equivalents. At the most adventurous end of the spectrum, passive outperformance has been the most significant: Parmenion Tactical Passive Risk Grade 10 returned 42.5% over the five years to the end of June, versus 24.4% from its Tactical Active equivalent.
Thornton-Boelman said a bias towards ‘quality’ companies and small caps in the active MPS range had also contributed to the performance differences.
Passive outperformance over three years is stark
Passive MPSs’ average outperformance over active across provider’s range
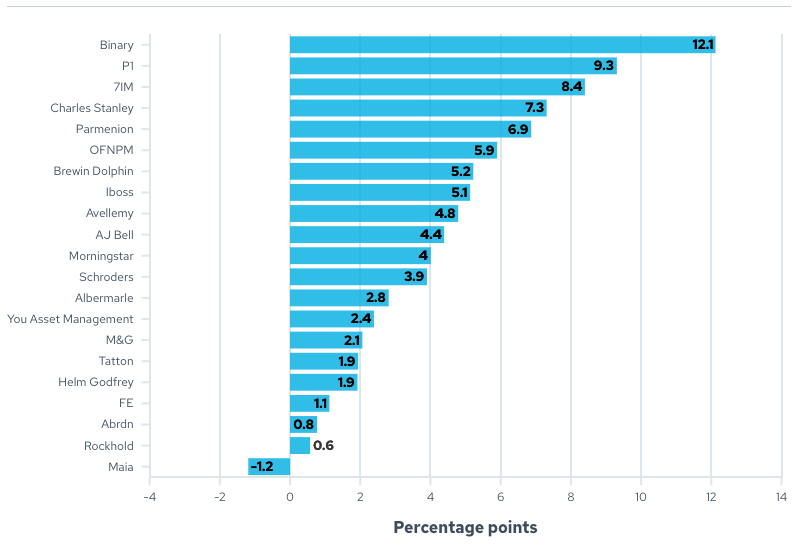
Sources: Morningstar, Mabel Insights, MPS providers • 3-year net returns to 30 June 2024
Similarly, Charles Stanley has been swapping some equity exposure for holdings in high yield bonds in its active Multi Manager Total Return MPS range, using the Man GLG High Yield Opportunities fund. But it has not done the same in its Dynamic Passive MPS range.
‘We’ve been swapping equity risk premia for high yield risk premia for a little while, which has been doing well and has been a very good stabiliser in portfolios,’ said Dan James, Charles Stanley head of asset management.
However, he added that the same approach was not viable across Charles Stanley’s passive MPSs as the high yield bond market was an area where ‘you don’t want to be buying the index’. Instead, he favours active managers such as Man GLG, who he said were ‘very good at picking the right credits – and that’s the important thing – and avoiding the bad ones’.
That has led to the passive MPSs running higher exposure to the US equity market – and by extension, the rallying Magnificent Seven – than their active counterparts, boosting returns. The most adventurous passive MPS in Charles Stanley’s range, Dynamic Passive 5, has outperformed its active counterpart by the largest margin: its 39.4% return over five years is ahead of 28.2% from the Charles Stanley Multi Manager Total Return 5 MPS.
‘It’s the classic old story that if you constrain an investment environment, what you tend to do is create more lumpy return profiles,’ said James.
‘In this case, it’s actually worked in favour of some of those passive products, whereas someone who is creating a more diversified portfolio has seen a slight drag on their returns. But I would argue that over the medium term, it’s all going to come out in the wash.’
Dickson, meanwhile, pointed to differing alternatives exposures between P1’s active and passive ranges. In its passive MPSs, physical gold in the form of the iShares Physical Gold exchange-traded commodity is used, while in P1’s active MPS range, gold mining and absolute return funds are employed.
Over the three years to the end of June, when the difference in performance between the two ranges is the most marked, iShares Physical Gold has returned 43.9%. Over the same period, the BlackRock Gold and General fund held in the active range is up just 6.8%, while the JPM Global Macro Opportunities absolute return fund, also held in the active range, is down 7.9%.
Money flows to low-cost approaches
Then there is the issue of cost contributing to passive MPSs’ performance advantage over active counterparts over the periods analysed. Morningstar research in 2022 found that passive MPS costs – including both the management fee and the underlying fund costs – stood at a median 0.3%, just over a third of the 0.85% costs attached to active counterparts.
All of that has led to mounting flows into passive MPSs.
‘Over the last couple of years, passives have seen the greatest interest,’ said Dickson. ‘Performance has been good, the cost is low, it’s simple to explain – it’s almost the ideal solution for the adviser.’
This in turn is raising the pressure on active managers to turn performance around. ‘You need to see some signs of that changing, otherwise investors will vote with their feet,’ said Kumar.
It may not take much for that change to come, said Thornton-Boelman. ‘When you do get those rotations, it can change quite quickly.’ he said.
‘Another bad labour print or more acknowledgement that AI spend isn’t going to result in benefits for another few years, and all of a sudden you can get a tech selloff in the US and broad active management is going to look really smart for being underweight there. I do think it goes in cycles.’


This website is aimed at Independent Financial Advisers, please tick the box to confirm that you are an IFA before entering the website.