Skip to content


Market Cap Dominance
Building on our recent educational piece titled US Tariffs: Policy, Purpose, and Potential Impact, the investment team have created the below infographic, which illustrates the scale of the world’s largest companies relative to major global indices.
It shows how market capitalisation dominance has become a key theme for investors, and why concentration risk is attracting more attention than ever before.
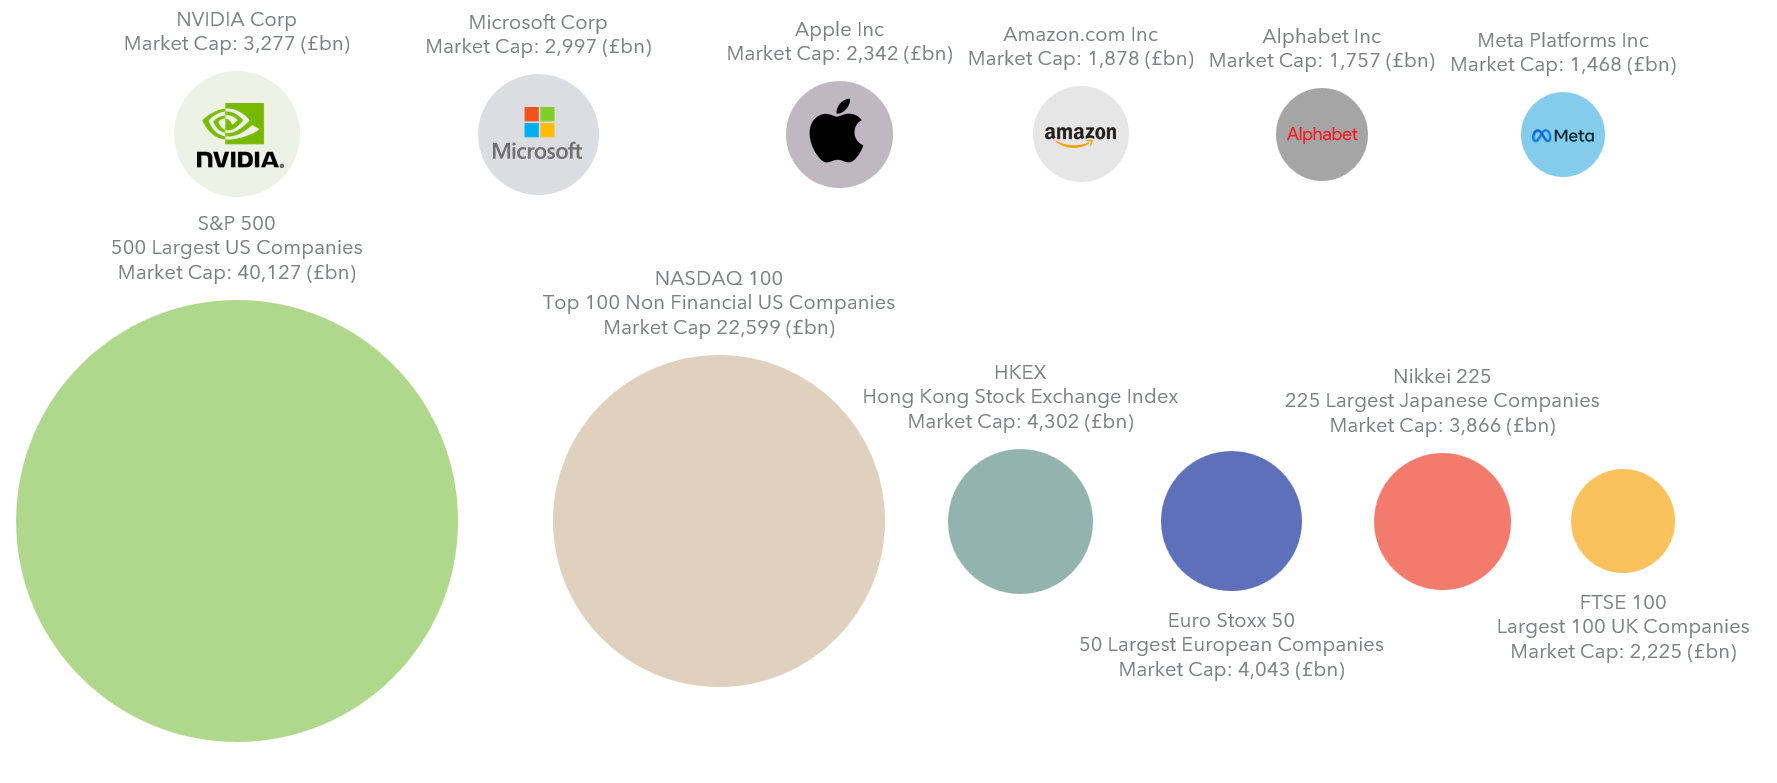
- The circle size represents total market capitalisation, with areas scaled proportionally to reflect the size of each stock or index.
- The four largest stocks are worth more than the FTSE 100, Nikkei 225, and Euro Stoxx 50 combined.
- When including the Hong Kong Exchange (HKEX) alongside the FTSE 100, Nikkei 225, and Euro Stoxx 50, the combined market cap is only 5% larger than that of the top six stocks.
- Nvidia’s market cap is 47% greater than the FTSE 100 index, Microsoft’s is 35% greater, and Apple’s is 5% greater.
Sources:
MAIA Asset Management Ltd,
Morningstar Direct (Sept 2025),
Slickcharts,
Stoxx,
Nikkei Indexes,
London Stock Exchange,
HKEX


Independent Financial Advisers
This website is aimed at Independent Financial Advisers, please tick the box to confirm that you are an IFA before entering the website.
I confirm I am an IFA